


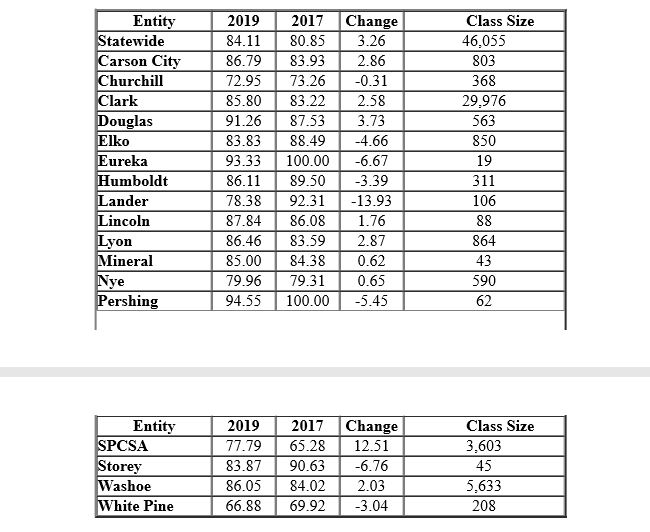
CARSON CITY Nev. - For the second year in a row, Nevada's high school students graduated at the highest rate ever at 84 .11 percent for the Class of 2019 - an increase of 3 .26 percentage points since 2017. "Our mission is to improve student achievement and educator effectiveness and this continued increase in our graduation rate demonstrates our collective progress as a statewide education system," said Jhone Ebert, Superintendent of Public Instruction. "The rising graduation rate coincides with other positive trends reported this year, including 184 schools that increased their rating by one or more stars and assessment outcomes that indicate that more of our students are demonstrating proficiency and college and career readiness." Nevada's three largest districts - Clark County School District, Washoe County School District, and the State Public Charter School Authority (SPCSA, which is considered a district for accountability purposes) - all showed increases in graduation rates. SPCSA had the most dramatic jump in graduation rates since 2017, with a 12.51 point increase. Other highlights include Douglas County School District, which improved by 3. 73 percentage points, and increases in graduation rate by more than 2 percentage points for the Lyon County, Carson City, Clark County, and Washoe County School Districts. The full list of graduation rates for 2018-19 is as follows:
 '
'
Pershing (94.55 percent), Eureka (93.33 percent), and Douglas (91.26 percent) have the highest graduation rates in the state. There are IO school districts with graduation rates that exceed the state average of 84 .11 percent. Graduation rates for students across all races/ethnicities are higher than in 2017:
- American Indian/Alaska Native students increased 0.45 percentage points to 74.36 percent;
- Asian students increased 1.09 percentage points to 94.18 percent;
- Black students increased 4 .4 5 percentage points to 72.18 percent;
- Hispanic students increased 3.25 percentage points to 82.95 percent;
- Two or More Races students increased 4.43 percentage points to 85.68 percent;
- Pacific Islander students increased 6.18 percentage points 88.52 percent.
- White students increased 3. 16 percentage points to 87.34 percent.;.
"We are proud that all of our students are demonstrating progress, but we are committed to addressing achievement gaps for student groups, including for our American Indian/Alaska Native, Black, and Hispanic students, as well as students who are differently abled, English language learners, and students who are eligible for free-or-reduced-price lunch," Ebert said. "Expanding access to educational opportunities and ensuring equitable access to effective educators vill be key to our efforts to provide every student who graduates with the tools they need to build a home, a life, and a future." Here are the graduation rates for students with disabilities, economically disadvantaged, and English learners over the past two years:
- Economically Disadvantaged students increased 3.97 percentage points to 80.81 percent;
- Students with Disabilities increased 2.42 percentage points to 67.15 percent; and
- English Learners (EL) decreased 4.86 percentage points to 76.8 percent since 2017; however, ELs increased 0. 76 to 76.8 percent over last year.
Graduation rates for Career and Technical Education students increased 2.96 points over the past nvo years. Career and Technical Education students have the highest graduation rate of any student population in the state at 94 .19 percent.